Apartment Marketing Statistics (2026): 60 Sourced Figures

Contents
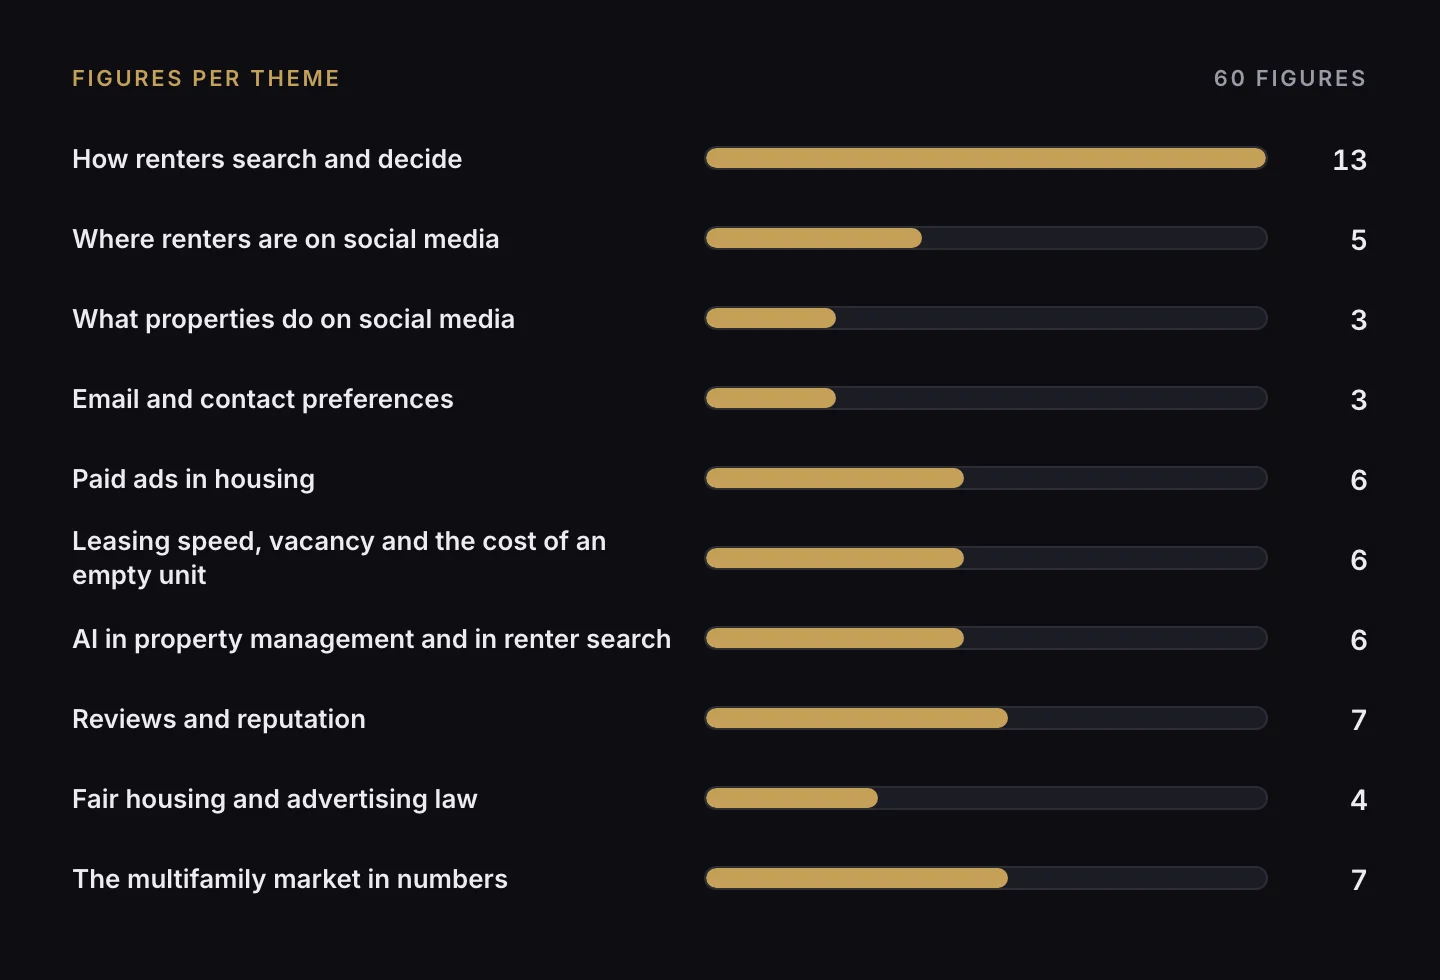
This page lists 60 figures in 10 themes. Each was read at its publisher on Oct 13, 2026, and each row links to the page it came from.
How we sourced this
- Every figure was read in the publisher's own report or page on the date in its row; no figure comes from another roundup.
- Wording follows the survey ("of renters surveyed", "U.S. adults aged 18-29"); we never turn a share into a want.
- Where the publisher sells the thing a figure favors (listings, ads, software), the row says so.
- A figure we could not trace to a primary source is not on this page; the ones in circulation that we skipped are listed, with why.
Last verified: Oct 13, 2026. Next review: Jan 2027. Changelog
How renters search and decide
In Apartments.com's Q4 2025 wave, 87% of prospective renters surveyed had no specific property in mind when they started; they plan to research 10 properties on average and seriously consider 3.
| Figure | Source and year | Sample | Row link |
|---|---|---|---|
| 85% of prospective renters surveyed use or plan to use a rental search app or site; 33% name property websites, 33% word of mouth and 32% search engines (multi-select, so shares add past 100%). | Apartments.com (CoStar), "How Renters Decide: Top Considerations in 2026" (Jul 14, 2026). Read Oct 13, 2026. Publisher sells listings. | About 27,000 U.S. renters (16,000 planning to rent plus about 11,000 recent searchers) | S1 |
| 87% of prospective renters surveyed (Q4 2025 wave) had no specific property in mind when they started; they plan to research 10 properties on average and seriously consider 3. | Apartments.com (CoStar), "Survey: How Today's Renters Choose a Place" (Feb 21, 2026). Read Oct 13, 2026. Publisher sells listings. | More than 15,000 U.S. adults planning to rent, 50 states plus DC; fielded Nov-Dec 2025 | S2 |
| The typical recent renter took one in-person tour; 19% of recent renters skipped touring; the share of recent renters taking 5+ tours fell from 16% (2018) to 9% (2024). | Zillow Group Population Science, "Rentals Consumer Housing Trends Report 2025" (2025 edition). Read Oct 13, 2026. Publisher sells listings. | 36,000+ unique renters (8,100+ recent); fielded Mar-Jul 2024 | S3 |
| 62% of recent renters submitted 2+ applications in 2024 (50% in 2018, a peak of 66% in 2023); the median application cost was $50. | Zillow Group Population Science, "Rentals Consumer Housing Trends Report 2025" (2025 edition). Read Oct 13, 2026. Publisher sells listings. | 36,000+ unique renters (8,100+ recent); fielded Mar-Jul 2024 | S4 |
| Zillow's news page says 81% of renters searched on a mobile website and 73% on an app, and that the typical renter used five different sites or apps. | Zillow Front Porch, "Rental search has evolved (quoting Zillow's 2026 Consumer Housing Trends Report)" (Jan 15, 2026). Read Oct 13, 2026. Publisher sells listings. The publisher's own summary; the full report was not opened. | Not stated on the news page; the report was not opened | S5 |
| In the Q2 2026 wave, 99% of prospective renters surveyed said unit-specific detail is important (63% extremely); 74% said they want online photos of the exact unit; 47% called missing exact-unit photos a deal-breaker. | Apartments.com (CoStar), "How Renters Decide: Top Considerations in 2026" (Jul 14, 2026). Read Oct 13, 2026. Publisher sells listings. | About 27,000 U.S. renters (16,000 planning to rent plus about 11,000 recent searchers) | S6 |
| 79% of renters surveyed said at least one digital feature is essential to a listing; of those calling each essential, photos were 56%, floor plan 49%, 3D or virtual tour 25% and video tour 20%. | Zillow Group Population Science, "Rentals Consumer Housing Trends Report 2025" (2025 edition). Read Oct 13, 2026. Publisher sells listings. | 36,000+ unique renters (8,100+ recent); fielded Mar-Jul 2024 | S7 |
| Zillow's news page says 57% consider at least one advanced digital media feature (drone capture, virtual staging, interactive 3D) essential, and 33% of recent renters call virtual staging essential. | Zillow Front Porch, "Rental search has evolved (citing Zillow's 2026 Consumer Housing Trends Report)" (Jan 15, 2026). Read Oct 13, 2026. Publisher sells listings. The publisher's own summary; the full report was not opened. | Not stated on the news page; the report was not opened | S8 |
| In the Q2 2026 wave, 81% of prospective renters surveyed prefer to see the total price with all required fees, and 46% of recent renters stopped considering a property after learning of surprise fees. | Apartments.com (CoStar), "How Renters Decide: Top Considerations in 2026" (Jul 14, 2026). Read Oct 13, 2026. Publisher sells listings. | About 27,000 U.S. renters (16,000 planning to rent plus about 11,000 recent searchers) | S9 |
| In the Q2 2026 wave, 88% of prospective renters surveyed said a discount or gift would make them more likely to consider a property (free month: 69%; discounted rent for 12 months: 66%). | Apartments.com (CoStar), "How Renters Decide: Top Considerations in 2026" (Jul 14, 2026). Read Oct 13, 2026. Publisher sells listings. | About 27,000 U.S. renters (16,000 planning to rent plus about 11,000 recent searchers) | S10 |
| 39.8% of rentals on Zillow offered concessions in spring 2026, up 5 points year over year; roughly 1 in 6 did before the pandemic. This is a share of Zillow listings, not of all U.S. rentals, and not a survey. | Zillow Research, "Nearly 40% of listings come with perks this spring (April Rental Report)" (May 27, 2026). Read Oct 13, 2026. Publisher sells listings. | Zillow listing data, not a survey | S11 |
| SatisFacts reports that 65% used listing sites, 51.7% visited a community's own website, 46% a traditional search engine and 11.5% AI-powered search or chat (multi-select). | SatisFacts, "2025 Biennial Online Renter Study" (Nov 24, 2025). Read Oct 13, 2026. | Sample size and fieldwork dates not printed on the page | S12 |
| In the Q2 2026 wave, 43% of prospective renters surveyed said they are likely to rent unseen (40% in the Q4 2025 wave), and 41% plan to move to another city or state. | Apartments.com (CoStar), "How Renters Decide: Top Considerations in 2026" (Jul 14, 2026). Read Oct 13, 2026. Publisher sells listings. | About 27,000 U.S. renters (16,000 planning to rent plus about 11,000 recent searchers) | S13 |
Where renters are on social media
In Apartments.com's Q4 2025 survey, 24% of renters surveyed reported using social media in their search, and 59% reported using YouTube every day.
| Figure | Source and year | Sample | Row link |
|---|---|---|---|
| 24% of renters surveyed reported using social media in their search. | Apartments.com (CoStar), "Survey: How Today's Renters Choose a Place" (Feb 21, 2026). Read Oct 13, 2026. Publisher sells listings. | More than 15,000 U.S. adults planning to rent, 50 states plus DC; fielded Nov-Dec 2025 | V1 |
| Renters surveyed reported using YouTube (59%), Instagram (57%) and Facebook (56%) every day. | Apartments.com (CoStar), "Survey: How Today's Renters Choose a Place" (Feb 21, 2026). Read Oct 13, 2026. Publisher sells listings. | More than 15,000 U.S. adults planning to rent, 50 states plus DC; fielded Nov-Dec 2025 | V2 |
| 84% of U.S. adults say they ever use YouTube, 71% Facebook, 50% Instagram and 37% TikTok (TikTok was 21% in 2021 and Instagram 40%; Pew advises caution comparing with years before 2023). | Pew Research Center, "Americans' Social Media Use 2025" (Nov 20, 2025). Read Oct 13, 2026. | 5,022 U.S. adults, Feb 5-Jun 18, 2025 | V3 |
| Eight in ten U.S. adults aged 18-29 say they use Instagram (19% of adults 65+). | Pew Research Center, "Americans' Social Media Use 2025" (Nov 20, 2025). Read Oct 13, 2026. | 5,022 U.S. adults, Feb 5-Jun 18, 2025 | V4 |
| Daily use among all U.S. adults: Facebook 52%, YouTube 48%, TikTok 24%. Among adults 18-29: YouTube 66%, Facebook 49%, TikTok 47%. Facebook is daily for 58% of adults aged 30-49 and 54% of adults aged 50-64. | Pew Research Center, "Americans' Social Media Use 2025 (appendix table)" (Nov 20, 2025). Read Oct 13, 2026. | 5,123 U.S. adults, Feb 24-Mar 2, 2025 (a separate survey from V3 and V4) | V5 |
What properties do on social media
57% of multifamily decision-makers surveyed by Apartments.com say their property or brand maintains social channels for current and prospective residents; 33% do not.
| Figure | Source and year | Sample | Row link |
|---|---|---|---|
| 57% of multifamily decision-makers surveyed say their property or brand maintains social channels for current and prospective residents; 33% do not and 9% are not sure. | Apartments.com (CoStar), "Survey: How Multifamily Communities Manage Social Media and Online Reputation" (Nov 7, 2025). Read Oct 13, 2026. Publisher sells social and reputation services. | Decision-makers representing 16,000 properties and 1.6 million units; respondent count not printed | P1 |
| Decision-makers surveyed report a social presence at nearly 40% of properties under 50 units, versus 65% of properties with 100+ units. | Apartments.com (CoStar), "Survey: How Multifamily Communities Manage Social Media and Online Reputation" (Nov 7, 2025). Read Oct 13, 2026. Publisher sells social and reputation services. | Decision-makers representing 16,000 properties and 1.6 million units; respondent count not printed | P2 |
| 65% of respondents say they post at least once a week (self-reported). | Apartments.com (CoStar), "Survey: How Multifamily Communities Manage Social Media and Online Reputation" (Nov 7, 2025). Read Oct 13, 2026. Publisher sells social and reputation services. | Decision-makers representing 16,000 properties and 1.6 million units; respondent count not printed | P3 |
Email and contact preferences
We found no free, primary email benchmark for multifamily, so this section holds what can be verified: 71% of renters surveyed said they want to email when they have questions, plus the FTC's and Gmail's rules for senders.
| Figure | Source and year | Sample | Row link |
|---|---|---|---|
| 71% of renters surveyed said they want to email when they have questions; 45% prefer to schedule tours online and 69% prefer to apply online. | Apartments.com (CoStar), "Survey: How Today's Renters Choose a Place" (Feb 21, 2026). Read Oct 13, 2026. Publisher sells listings. | More than 15,000 U.S. adults planning to rent, 50 states plus DC; fielded Nov-Dec 2025 | E1 |
| Each separate email that violates CAN-SPAM can draw penalties of up to $53,088, and an opt-out request must be honored within 10 business days. | Federal Trade Commission, "CAN-SPAM Act: A Compliance Guide for Business" (undated). Read Oct 13, 2026. | Rule text, no sample; the amount matches 16 CFR §1.98(d) and the FTC's Sept 15, 2026 notice that 2026 penalty amounts stay unchanged (FR 2026-18853) | E2 |
| Gmail's bulk-sender rules (5,000+ messages a day, in force since Feb 1, 2024): keep the Postmaster spam rate under 0.10% and never reach 0.30%; one-click unsubscribe on marketing mail; SPF, DKIM and DMARC. | Google Workspace Admin Help, "Email sender guidelines" (undated). Read Oct 13, 2026. | Rule text, no sample | E3 |
Paid ads in housing
LocaliQ's benchmarks put cost per lead at $99.48 (median) for Apartments & Rentals search ads and $13.74 for Real Estate Facebook lead ads; Meta and Google both restrict how housing ads can be targeted.
| Figure | Source and year | Sample | Row link |
|---|---|---|---|
| Apartments & Rentals search ads (Google, Microsoft), median: click-through 7.73%, cost per click $3.10, conversion rate 3.42%, cost per lead $99.48. A conversion here is an ad response, not a lease. | LocaliQ (WordStream), "2026 Real Estate Search Advertising Benchmarks" (Sep 14, 2026). Read Oct 13, 2026. Published by a vendor that sells ad management. | 894 U.S. campaigns, Apr 2025-Mar 2026; each subcategory has at least 11 campaigns | A1 |
| Property Management search ads, median: click-through 6.66%, cost per click $3.94, conversion rate 10.24%, cost per lead $76.71. The 10.24% is the outlier of the report's five subcategories. | LocaliQ (WordStream), "2026 Real Estate Search Advertising Benchmarks" (Sep 14, 2026). Read Oct 13, 2026. Published by a vendor that sells ad management. | 894 U.S. campaigns, Apr 2025-Mar 2026; each subcategory has at least 11 campaigns | A2 |
| Facebook lead-ad campaigns in the Real Estate category (not apartments alone): click-through 4.17%, cost per click $1.27, conversion rate 9.95%, cost per lead $13.74; traffic campaigns: 2.37% and $0.55. A lead-form lead is not a qualified lead. | LocaliQ with WordStream, "Facebook Advertising Benchmarks for 2026" (Sep 23, 2026). Read Oct 13, 2026. Published by a vendor that sells ad management. | 20 industries; campaign count not on the page | A3 |
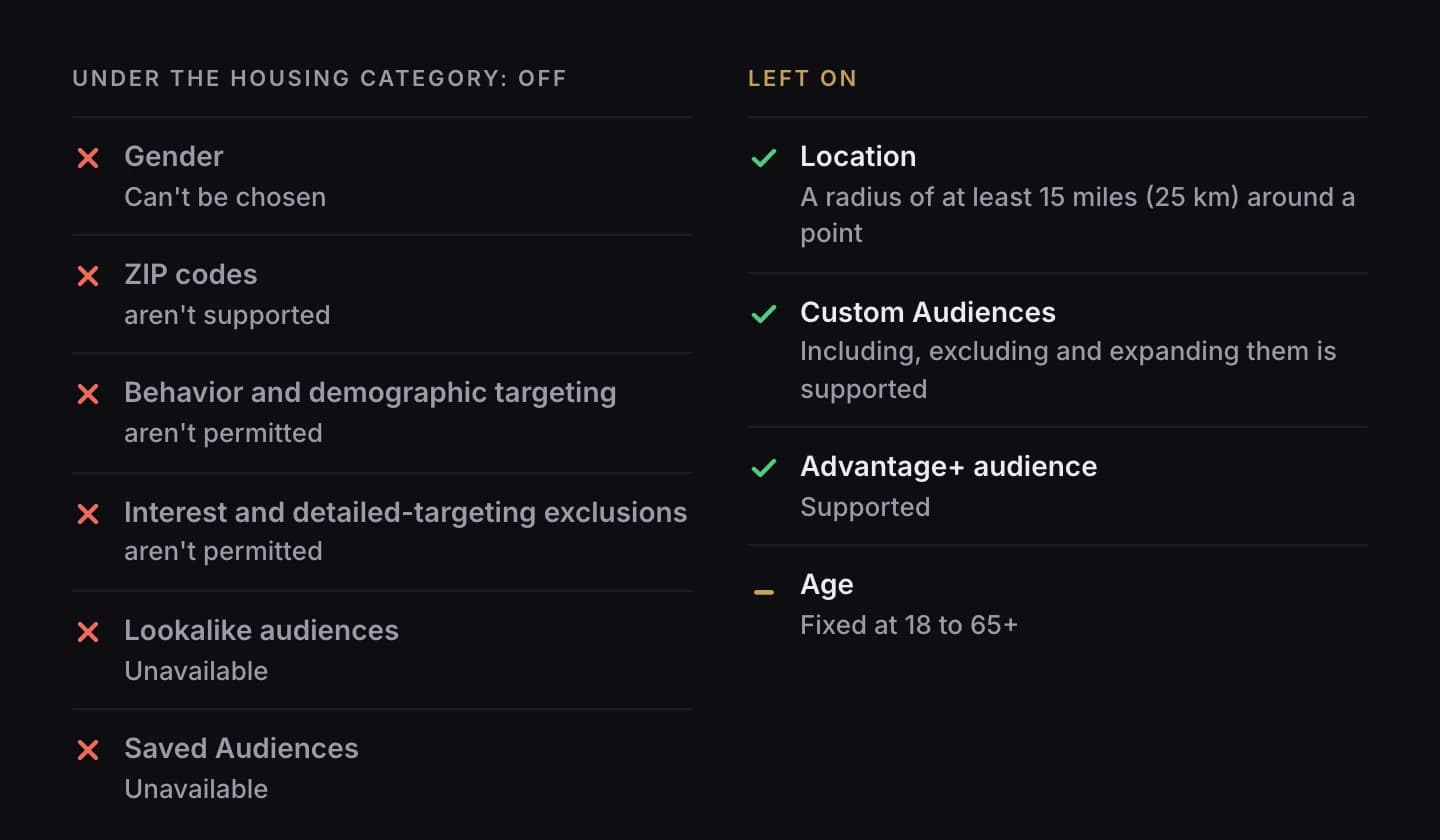
| Since Dec 4, 2019, U.S. advertisers must declare housing campaigns (a Special Ad Category) or the ads cannot run. For them, age is "generally fixed" at 18 through 65+, there is no gender selection, location must cover at least a 15-mile (25 km) radius with no neighborhood or ZIP targeting, and lookalike audiences and detailed-targeting exclusions are not available. | Meta for Developers, "Special Ad Category (Marketing API docs)" (undated). Read Oct 13, 2026. | Policy text, no sample | A4 |
| Google's housing ads policy for the U.S. and Canada: age, gender and parental status must stay enabled (no exclusions); marital-status and parental-status demographics and full ZIP targeting are restricted, so use city, state or radius instead. | Google Ads Help, "Housing ads policy" (undated). Read Oct 13, 2026. | Policy text, no sample | A5 |
| A court approved the United States v. Meta settlement on June 27, 2022. Meta stopped using its Special Ad Audience tool for housing, built a Variance Reduction System and paid a $115,054 civil penalty, the largest the Fair Housing Act allowed then. It was a settlement of allegations, not a finding of liability. | U.S. Department of Justice, Civil Rights Division, "United States v. Meta Platforms, Inc. (S.D.N.Y.)" (undated). Read Oct 13, 2026. | Court settlement, no sample | A6 |
Leasing speed, vacancy and the cost of an empty unit
On Apartment List, units took an average of 34 days from listing to lease in Sept 2026, the longest September since tracking began in 2019.
| Figure | Source and year | Sample | Row link |
|---|---|---|---|
| Units took an average of 34 days from listing to lease on Apartment List in Sept 2026, the longest September since tracking began in 2019 (record 41 days in Jan 2026). This is one marketplace's list-to-lease time, not national days on market. | Apartment List, "National Rent Report" (Sep 29, 2026). Read Oct 13, 2026. Publisher sells listings. | Apartment List's proprietary marketplace data | L1 |
| Apartment List's national multifamily vacancy index was 7.0% in Sept 2026, down from a 7.3% peak in Feb (the highest since tracking began in 2017); the 2017-2019 average was 6.4%. It is an index of stabilized properties on its platform. | Apartment List, "National Rent Report" (Sep 29, 2026). Read Oct 13, 2026. Publisher sells listings. | Apartment List's proprietary marketplace data | L2 |
| The U.S. rental vacancy rate was 7.3% in Q2 2026 (7.0% a year earlier, a change the Census Bureau calls not statistically different); 3.727 million units were vacant for rent, with a median asking rent of $1,531. It covers all rental housing, not only apartments in 5+ unit buildings. | U.S. Census Bureau, "Quarterly Residential Vacancies and Homeownership, Second Quarter 2026 (CB26-116)" (Jul 28, 2026). Read Oct 13, 2026. The link is Census's current-release file; the Oct 28, 2026 release replaces it. Cite the release number and date. | Current Population Survey / Housing Vacancy Survey | L3 |
| Yardi Matrix reported that the national occupancy rate fell to its lowest level since 2013 in May 2026. | Yardi Matrix, "Press release" (Jun 4, 2026). Read Oct 13, 2026. Publisher sells software and data. | Not printed on the press page | L4 |
| EliseAI's survey found that 61% of renters contact more than one community before signing and 73% expect a reply by the end of the same business day. | EliseAI, "2026 State of AI in U.S. Multifamily" (Jul 29, 2026). Read Oct 13, 2026. Published by a vendor that sells AI leasing. | 500 renters (plus 350 operators), run by an independent research firm | L5 |
| Our calculation: at the Census median asking rent of vacant units ($1,531 a month, L3), an empty apartment forgoes about $50 of asking rent a day ($1,531 / 30.4); at Apartment List's 34 days list-to-lease (L1), that is about $1,700. | Lease Velocity (our arithmetic), "Calculated from L3 and L1". Inputs: census.gov and apartmentlist.com. Our calculation, not a published statistic. | Not a survey: two published figures; asking rent, not realized rent | L6 |
AI in property management and in renter search
4% of prospective renters surveyed by Apartments.com (Q2 2026 wave) report using generative-AI chatbots in their rental search; 89% of multifamily operators surveyed by EliseAI have introduced AI to some degree.
| Figure | Source and year | Sample | Row link |
|---|---|---|---|
| 53% of industry professionals surveyed use general-purpose AI tools such as ChatGPT and Gemini, and 43% use AI features built into their property-management software (multi-select; real-estate professionals, not only multifamily). | National Apartment Association research, sponsored by AppFolio, "2025 Performance Ecosystem Report" (Dec 10, 2025). Read Oct 13, 2026. Publisher sells property-management software. | 1,984 industry professionals, fielded Jul 16-Aug 4, 2025 | I1 |
| 89% of multifamily operators surveyed have introduced AI to some degree (EliseAI's own threshold); 34% have fully deployed it (24% in 2025); 85% of operators with AI report lower operating expenses. | EliseAI, "2026 State of AI in U.S. Multifamily" (Jul 29, 2026). Read Oct 13, 2026. Published by a vendor that sells AI leasing. | 350 operators (the 2025 comparison had n=280) | I2 |
| Apartments.com says use of AI-generated marketing grew 26% between 2024 and 2025 among multifamily marketers. That is relative growth, not a share using AI. | Apartments.com (CoStar), "2026 Multifamily Trends: What to Expect" (Oct 17, 2025). Read Oct 13, 2026. Publisher sells listings. | Sample and base not stated on the page | I3 |
| In the Q2 2026 wave, 4% of prospective renters surveyed report using generative-AI chatbots in their rental search; 30% use ChatGPT-like tools daily or weekly elsewhere in life; 41% say they are likely to rely on an AI chatbot's recommendation. | Apartments.com (CoStar), "How Renters Decide: Top Considerations in 2026" (Jul 14, 2026). Read Oct 13, 2026. Publisher sells listings. | About 27,000 U.S. renters (16,000 planning to rent plus about 11,000 recent searchers) | I4 |
| 34% of U.S. adults have ever used ChatGPT (58% of adults under 30); 66% have not. | Pew Research Center, "34% of U.S. adults have used ChatGPT" (Jun 25, 2025). Read Oct 13, 2026. | 5,123 U.S. adults, Feb 24-Mar 2, 2025 | I5 |
| 45% of consumers surveyed use ChatGPT or other generative AI for local-business recommendations, up from 6% a year earlier (general local businesses, not apartments). | BrightLocal, "Local Consumer Review Survey 2026" (Feb 11, 2026). Read Oct 13, 2026. Publisher sells local SEO. | 1,002 U.S. adult consumers, via SurveyMonkey | I6 |
Reviews and reputation
96% of renters surveyed said reviews are important to their decision (Apartments.com, Q2 2026 wave); 47% of residents surveyed by NMHC and Grace Hill expect management to answer all online reviews.
| Figure | Source and year | Sample | Row link |
|---|---|---|---|
| In the Q2 2026 wave, 96% of renters surveyed said reviews are important to their decision (97% in the Q4 2025 wave). | Apartments.com (CoStar), "How Renters Decide: Top Considerations in 2026" (Jul 14, 2026). Read Oct 13, 2026. Publisher sells listings. | About 27,000 U.S. renters (16,000 planning to rent plus about 11,000 recent searchers) | R1 |
| 35% of renters surveyed said seeing reviews of the property manager or landlord is essential (reviews of the manager, not of the property). | Zillow Group Population Science, "Rentals Consumer Housing Trends Report 2025" (2025 edition). Read Oct 13, 2026. Publisher sells listings. | 36,000+ unique renters (8,100+ recent); fielded Mar-Jul 2024 | R2 |
| 79% of residents surveyed said reviews influenced their leasing decisions; 71% of residents who researched online reviews said the content of the ratings stopped them from visiting; 47% expect management to answer all online reviews. | NMHC and Grace Hill, "Renter Preferences Survey Report 2024, as printed in Grace Hill's infographic" (2024 edition). Read Oct 13, 2026. Publisher sells reputation tools. The publisher's own summary; the full report was not opened. | More than 172,700 responses, 77 markets | R3 |
| 83% of renters surveyed said management affects their future lease decisions; 14% said they would not consider another property with the same management. | NMHC and Grace Hill, "Renter Preferences Survey Report 2024, as printed in Grace Hill's infographic" (2024 edition). Read Oct 13, 2026. Publisher sells reputation tools. The publisher's own summary; the full report was not opened. | More than 172,700 responses, 77 markets | R4 |
| 97% of consumers surveyed read online reviews for local businesses (41% "always", up from 29%); 74% look for reviews from the last three months; 31% use only businesses rated 4.5 stars or more (17% a year ago) and 68% only 4+ (55%). These are general consumers across all local businesses, not renters. | BrightLocal, "Local Consumer Review Survey 2026" (Feb 11, 2026). Read Oct 13, 2026. Publisher sells local SEO. | 1,002 U.S. adults | R5 |
| 84% of multifamily decision-makers surveyed say their properties have online ratings and reviews; 82% have a strategy to respond; 54% are satisfied with their ratings. | Apartments.com (CoStar), "Survey: How Multifamily Communities Manage Social Media and Online Reputation" (Nov 7, 2025). Read Oct 13, 2026. Publisher sells social and reputation services. | Decision-makers representing 16,000 properties and 1.6 million units; respondent count not printed | R6 |
| The FTC's rule at 16 CFR Part 465 (89 FR 68077, Aug 22, 2024; effective 60 days later) bars fake or purchased reviews, undisclosed insider reviews, company-run "independent" review sites and review suppression. Knowing violators face civil penalties; the FTC civil penalty ceiling is $53,088 per violation (16 CFR §1.98). | eCFR (rule text) and FTC press release of Aug 14, 2024, "16 CFR Part 465" (Aug 22, 2024). Read Oct 13, 2026. | Rule text, no sample | R7 |
Fair housing and advertising law
It is unlawful to publish a rental ad that indicates a preference, limitation or discrimination based on a protected class, and HUD's withdrawal of its 2024 digital-advertising guidance did not change that.
| Figure | Source and year | Sample | Row link |
|---|---|---|---|
| It is unlawful to publish any rental ad that indicates a preference, limitation or discrimination based on a protected class. HUD's rule counts "words, phrases, photographs, illustrations, symbols or forms" and "selecting media or locations" that deny segments of the market information. General information, not legal advice. | Cornell LII (42 U.S.C. §3604(c)) and eCFR (24 CFR §100.75), "42 U.S.C. §3604(c); 24 CFR §100.75(c)(1), (c)(3)" (undated). Read Oct 13, 2026. Also: ecfr.gov. | Rule text, no sample | F1 |
| HUD civil-penalty ceilings per discriminatory housing practice: $26,262 (first), $65,653 (one prior in 5 years), $131,308 (two or more in 7 years). These are administrative law judge ceilings; courts have separate remedies. | eCFR, "24 CFR §180.671 (last amended 90 FR 24748)" (Jun 12, 2025). Read Oct 13, 2026. | Rule text, no sample | F2 |
| HUD withdrew its April 29, 2024 digital-advertising guidance effective Sept 17, 2025 (published Apr 6, 2026). The notice says conduct that does not comply with the Act's text "continue[s] to be subject to enforcement", and complainants have two years to sue. Withdrawn guidance is not a looser law. | Federal Register (HUD), "FR Doc 2026-06624, Docket FR-6571-N-01" (Apr 6, 2026). Read Oct 13, 2026. | Rule text, no sample | F3 |
| 32,321 housing-discrimination complaints were reported in 2024 (34,150 in 2023); 27,007 (83.56%) were in the rental market; 108 were discriminatory-advertising complaints (0.33%). These are complaints, not incidents, and the report says funding cuts may suppress future counts. | National Fair Housing Alliance, "2025 Fair Housing Trends Report" (Nov 2025). Read Oct 13, 2026. | Complaints reported by private fair housing organizations, HUD, Fair Housing Assistance Programs and DOJ | F4 |
The multifamily market in numbers
Renters occupy 46.8 million U.S. housing units, 31.3% of all housing units in Q2 2026, and a record 22.7 million renter households were cost burdened in 2024.
| Figure | Source and year | Sample | Row link |
|---|---|---|---|
| 46.8 million renter-occupied housing units in Q2 2026, 31.3% of 149.5 million housing units; the homeownership rate was 65.0%. These are units, not households or people. | U.S. Census Bureau, "Quarterly Residential Vacancies and Homeownership, Second Quarter 2026 (CB26-116), Table 3" (Jul 28, 2026). Read Oct 13, 2026. The link is Census's current-release file; the Oct 28, 2026 release replaces it. Cite the release number and date. | Table 3 of the release | M1 |
| NMHC estimates 23 million apartment units in the U.S., 41% of them one-bedroom. The page gives no year; its downloadable sheet shows 23.5 million occupied units in 2020 (American Housing Survey, updated 2021). | National Multifamily Housing Council (NMHC), "Quick Facts: Apartment Stock" (undated). Read Oct 13, 2026. | No year or source on the page | M2 |
| 57,435 residential property-manager establishments employing 507,375 paid workers (2022 data; the category is primarily apartment management but also includes condo and single-family rental managers). | NMHC, from the Census Bureau's County Business Patterns, "Residential property managers by state (2022 County Business Patterns)" (Updated Jun 2024). Read Oct 13, 2026. | Establishment counts, 2022 | M3 |
| A record 22.7 million renter households were cost burdened in 2024 (49%). Separately, Gen Z heads 10.4 million households, 23% of all renters. | Harvard Joint Center for Housing Studies, "America's Rental Housing 2026, Key Facts" (2026 edition). Read Oct 13, 2026. | Not stated in the Key Facts | M4 |
| Multifamily completions: 608,000 units in 2024 (the most since 1986) and 488,000 in 2025. | Harvard Joint Center for Housing Studies, "America's Rental Housing 2026, Key Facts" (2026 edition). Read Oct 13, 2026. | Not stated in the Key Facts | M5 |
| Multifamily operators' marketing, tax and maintenance costs rose more than 10% between 2019 and 2024 (insurance doubled). JCHS groups marketing with taxes and maintenance in that sentence. | Harvard Joint Center for Housing Studies, "America's Rental Housing 2026, Key Facts" (2026 edition). Read Oct 13, 2026. | Not stated in the Key Facts | M6 |
| Zillow's news page says the median renter is 41, 37% of renters have children at home, and nearly 60% of renters planning to move expect to keep renting. | Zillow Front Porch, "News page citing Zillow's latest Consumer Housing Trends Report" (Mar 27, 2026). Read Oct 13, 2026. Publisher sells listings. The publisher's own summary; the full report was not opened. | Not stated on the news page; the report was not opened | M7 |
Where the sources disagree
Five gaps in the rows above.
- Renter AI use. Apartments.com reports that 4% of prospective renters surveyed used generative-AI chatbots in their rental search (I4). SatisFacts reports 11.5% used AI-powered search or chat, from a multi-select list, and does not print its sample size (S12). The questions are worded differently, and a third, much higher figure circulates that we do not repeat (Numbers we don't repeat).
- Community websites. Apartments.com reports that 33% of prospective renters surveyed use property websites (S1). SatisFacts reports that 51.7% visited a community's own website (S12). Both are multi-select, and Apartments.com sells listings.
- Vacancy. Apartment List's index of stabilized properties on its platform read 7.0% in Sept 2026 (L2). The Census Bureau's rental vacancy rate, which covers all rental housing, read 7.3% in Q2 2026 (L3). The definitions and the months differ.
- Touring. Apartments.com reports that 43% of prospective renters surveyed are likely to rent unseen (S13). Zillow's news page of Mar 27, 2026 says more than half call an in-person tour essential (M7), and Zillow's 2025 report found that 19% of recent renters skipped touring (S3).
- One publisher, two waves. Apartments.com's own waves differ on the same question: reviews are important to 97% in Q4 2025 and 96% in Q2 2026 (R1); 85% and then 81% prefer to see the total price with fees, on a different base (S9); 77% and then 74% said they want online photos of the exact unit (S6); 40% and then 43% are likely to rent unseen (S13). Name the wave whenever you cite one.
Numbers we don't repeat
Ten claims in circulation.
| Claim | Where it traces | Why we left it out |
|---|---|---|
| "Video listings get 403% more inquiries." | A Real Estate Business article of March 11, 2013, quoting a Melbourne agency's own 2012 review. Trade blogs and at least one advertising-benchmark page still repeat it. | One agency reported its own results in 2012. Retellings credit the figure to the National Association of Realtors, and that credit is false. |
| "3D tours sell 31% faster." | A 2020 post by a 3D-capture vendor, Matterport. | It concerns homes for sale, says "up to", was published by the vendor and is correlational. |
| "Virtual tours get 87% more views" and "drone photos sell 68% faster." | Vendor blogs that cite one another; a National Association of Realtors page repeats a New Jersey drone blog. | The chain is circular, the MLS behind it is unnamed, and "more likely to sell" turned into "faster" along the way. |
| "80% of apartment seekers check your social media before signing their next lease." | Grace Hill's reputation brochure and infographic. The brochure footnotes it to MRI Software, 2023, not to the NMHC and Grace Hill survey. | We have not seen MRI's underlying source, and the survey it is printed beside does not contain it. |
| "42% checked social," "79% visited a property website" and "73% photos," credited to NMHC and Grace Hill. | Trade blogs, crediting the NMHC and Grace Hill Renter Preferences Survey. | The full report is paid. Every appearance we traced was secondhand, and Grace Hill's free infographic does not contain them. |
| "71% of renters searching for a new apartment won't visit a property if the reviews aren't stellar." | Grace Hill's brochure. | Paraphrase drift. The survey's base was residents who researched online reviews, and the effect was that the content of the ratings stopped them from visiting. Row R3 holds the survey's own wording. |
| "45.9% of renters now use AI to research apartments" and "5.7% began their search with AI." | A research firm's podcast page (Jan 28, 2026) and a study page. | Neither page gives a sample, fieldwork dates or a method, and the reports are gated. Rows I4 and S12 hold the renter AI figures from named publishers. |
| Real-estate email open rates of "about 22%" or "19.8%." | Trade and agency blogs, crediting Mailchimp. | Mailchimp's current benchmark page shows no real-estate row (its full report is gated), and the 22% traces to a 2015 secondhand source. Mailchimp warns that Apple Mail Privacy Protection distorts open rates. |
| "98 percent of renters care about ratings and reviews." | An Apartments.com article of Nov 7, 2025, citing "the latest renter survey" without naming a wave. | The same question reads 96% in the Q2 2026 wave and 97% in the Q4 2025 wave. Always name the wave (row R1). |
| "Contact odds drop 100x," credited to MIT and InsideSales. | A 2007 business-to-business study funded by a vendor. | It was a business-to-business result, not a renter finding. |
Cite this page
Lease Velocity, "Apartment Marketing Statistics 2026," updated October 13, 2026, https://www.leasevelocity.co/blog/apartment-marketing-statistics.
To cite one figure, link its row, for example https://www.leasevelocity.co/blog/apartment-marketing-statistics#S6, and name the publisher, report and dates in that row.
To link to this page:
<a href="https://www.leasevelocity.co/blog/apartment-marketing-statistics">Apartment Marketing Statistics 2026 (Lease Velocity)</a>Changelog
- Oct 13, 2026. First edition: 60 figures, each read at its publisher that day.
This page's date changes only when a row does.
Related
Lease Velocity